


How to read and use a growth chart
The best way to track your child’s growth
-
Growth charts are some of the most important tools your child's doctor has. They help to provide a picture of your child's general health. The doctor (or other care provider) can quickly see how well your child is gaining weight and growing compared to other children the same age. In special situations (like Down syndrome or premature babies, for example) those measurements can also be compared to children who are similar.
The best use of the information comes over time, because weight gain and growth are continuous in childhood. It's not just that particular office visit when your child is weighed and measured, and that single point on the chart that matters. But how growth tracks from the last visit and the one before that–so that an entire graph is created. Unlike business and stock graphs that can fluctuate depending on all sorts of conditions, a growth chart can usually tell us what to expect in the future, and again how that compares with similar children.
Learn how to use a growth chart
An example will help you understand what a growth chart can tell you–and it will help you create one that's meaningful for your child.
Let's say that Bobby Jones comes into the doctor on his fifth birthday for his routine checkup. He has been healthy, without any recent illnesses. The doctor's staff measures him at 44 inches and weighs him at 40 pounds. If you go to the growth chart below, you will see age (in years) along the bottom and on the lower graph weight (in both pounds (lb) and kilograms (kg). In the upper curves, you see height (in inches (in) and centimeters (cm).
Since Bobby is 5 years old, you can make a line go up from that age. Where his height of 44 inches meets the 5 year old line, draw a point and then do the same for his weight of 40 pounds. If you then follow the curves where those points are, on the right you will see that Booby is at the 75th percentile for height 50th percentile for weight.
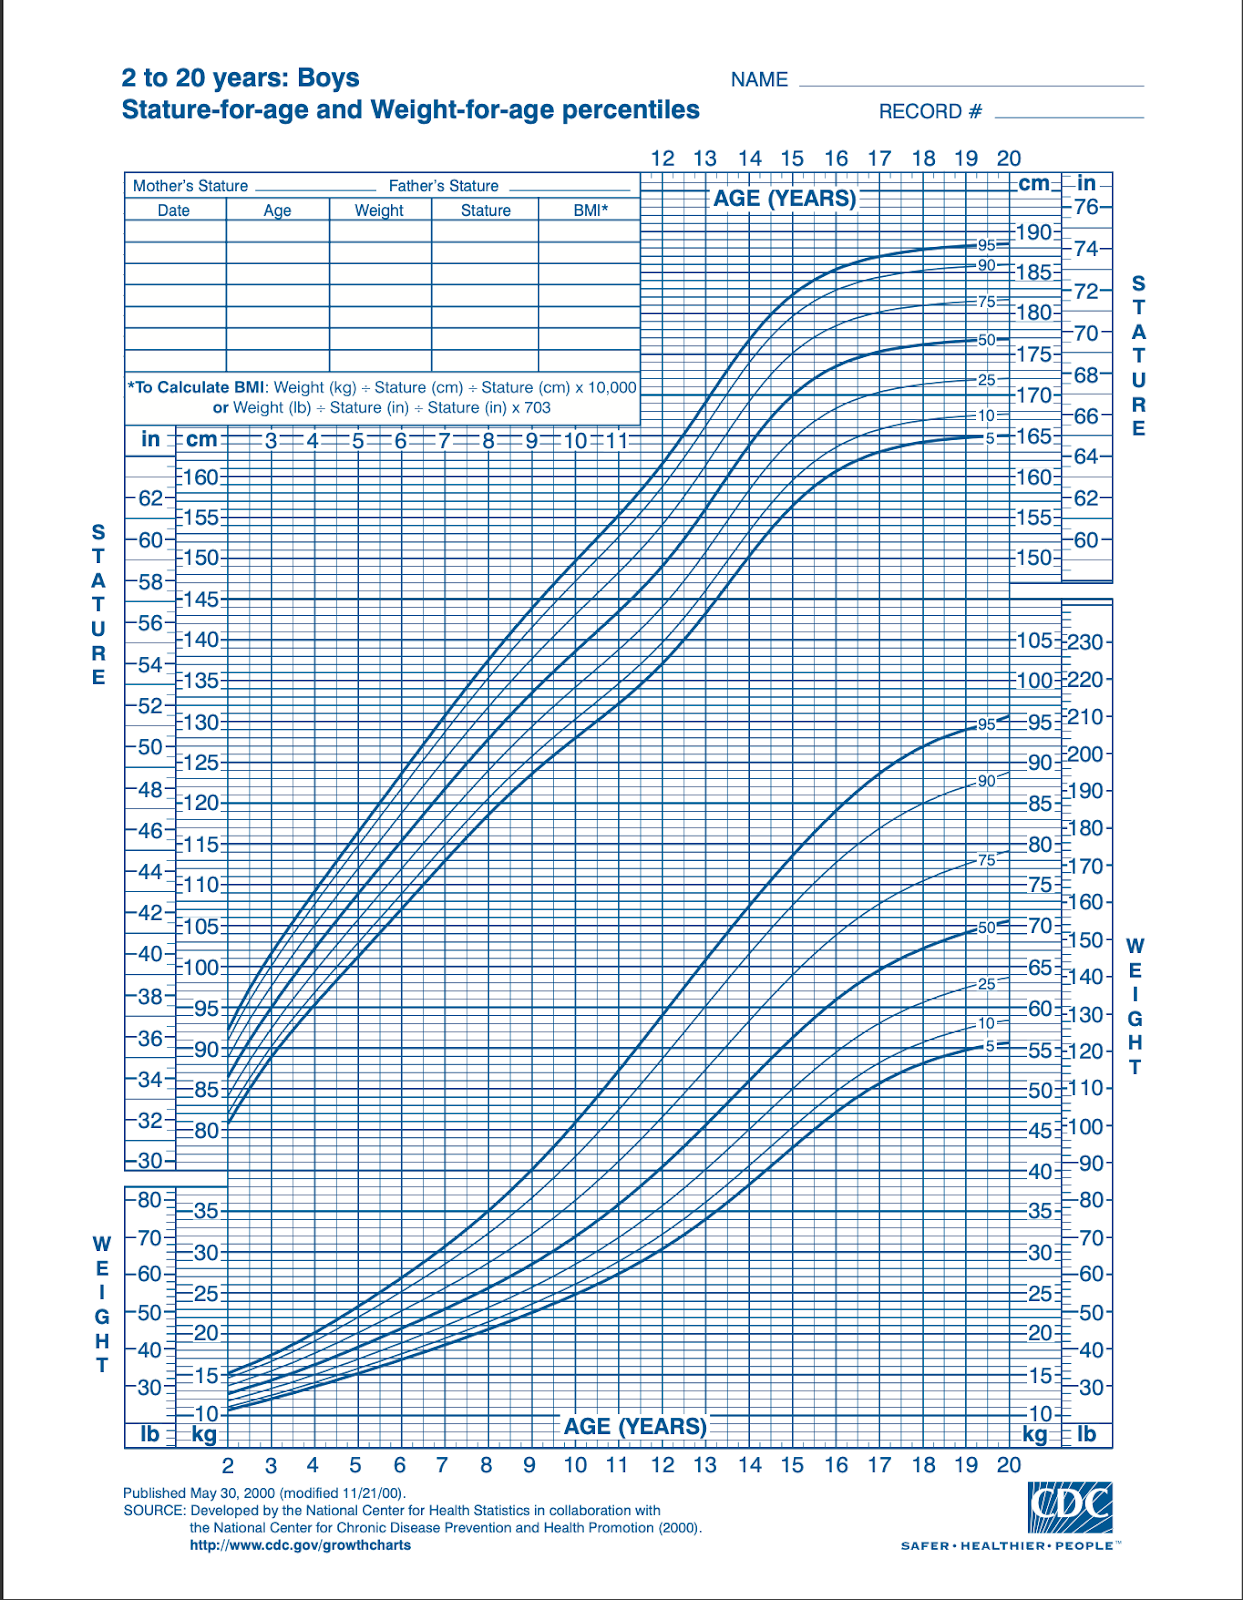
What does that mean? At the 75th percentile for height, Bobby would stand at the top quarter of the kids his age. Twenty-five percent would be taller but he would be taller than 74 percent of the others. With his weight at the 50th percentile, it means he's right in the middle. And obviously, both Bobby's height and weight are probably normal.
Expectations for a child growth
- Not everyone is right in the middle. Most people will fall between the 25th-50th percentile, but you can still be in the normal range at the 5th-95th percentile.
- Adjustments can be made for the child whose parents are extremely tall or short. Expectations are different, and we often use "the mid-parent height" as a way to predict the child's eventual height, though that can vary 3 inches either way.
- When parents are lean, that will often mean that the children will be expected to be thin (because of their genetics, and perhaps, their diet).
- When the parents are overweight, that doesn't mean that the children also have to be overweight. While being overweight can be influenced by genetics, it is usually caused by diet and lifestyle. Hopefully, that can be changed so the children don't grow up with obesity and all the problems that can arise–so please see our articles on Obesity and our Healthy Lifestyle for a Lifetime.
- Children generally grow and gain along the same percentiles over time.
- Some "late-bloomers" may grow along the lower percentiles for a while, but then accelerate their growth later in their teen years, particularly if their parents did that too.
- Families moving from into the US from other countries might find that the difference in diet can add extra height and extra pounds.
- But it is never normal to decrease in percentiles for height or weight (other than the large baby at birth or the monster breastfeeder, who then drift down to their normal growth curve a little while later)
The single measurement isn't enough to assure the child is doing well nutritionally or health-wise. I said Bobby was probably healthy. If Bobby was previously growing and gaining at the 95% and has now slowed down or he hasn't gained in the last 6 months, his current numbers may actually point to a problem.
Next Steps
You can go back to your old records and look back at what Bobby measured and weighed before, and now you can plot each new measurement on the growth chart. You won't see much difference in height unless you go out a year or more, since the average child grows 2 inches a year from 2 years of age until puberty. You can track weight more frequently, remembering that most children gain approximately 5 pounds per year during that same time frame.
So to take our example, Bobby now comes in at 6 years old. He measures 47 inches and is 46 pounds. When his measurements are plotted, he is again at the 75th percentile for height and the 50th for weight. Great. But if he had only gained to 42 pounds, he would be at the 25th pounds, raising some concern. It could be that he recently had the flu and wasn't feeling well enough to eat. But most children will regain any losses within a week or two, so if it was a while ago, you may want to recheck his weight in a few weeks.
So use the growth charts here to watch your child's weight and height as another way to monitor their nutrition and general health. If there's any concern, express that to your primary care provider.